Tour de France 2012
— That’s it for this year …
After we all recovered from the “shock” that Spanish soccer is still hard to beat (no matter if you are Italian or German …) its time to look into this year’s Tour de France data.
After the first 4 stages passed, I will start to log the results in the usual ways as in 2005, 2006, 2007, 2008, 2009, 2010 and 2011 now:
STAGE 4: still 45 riders very compact, but hey – a German winner …
STAGE 5: almost no change in the classement
STAGE 6: a massive pile up of dozens of riders cuts the leading group by half
STAGE 7: not CANCELLARA’s day, he gave the jersey to WIGGINS for now …
STAGE 8: RADIOSHACK-NISSAN now the leading team.
STAGE 9: again a strong performance of WIGGINS, but the mountains will tell …
STAGE 10: a group of 5 makes the day, but can’t challenge the yellow jersey
STAGE 11: quite some shake up in the ranks, but no surprises at the top
STAGE 12: team RADIOSHACK with 4 riders in the top 15
STAGE 13: no changes in the top 15 for two stages now
STAGE 14: as neither the top 15 nor flop 15 change, its time to look at the drop-outs
STAGE 15: the small group of 6 breakaways can’t change the field
STAGE 16: VOECKLER’S day, but nobody to stop WIGGINS
STAGE 17: The leaders make the day; only 2 stages left
STAGE 18: Jan GHYSELINCK’S mysterious reentry of the Tour …
STAGE 19: WIGGINS faster than ever – how come?
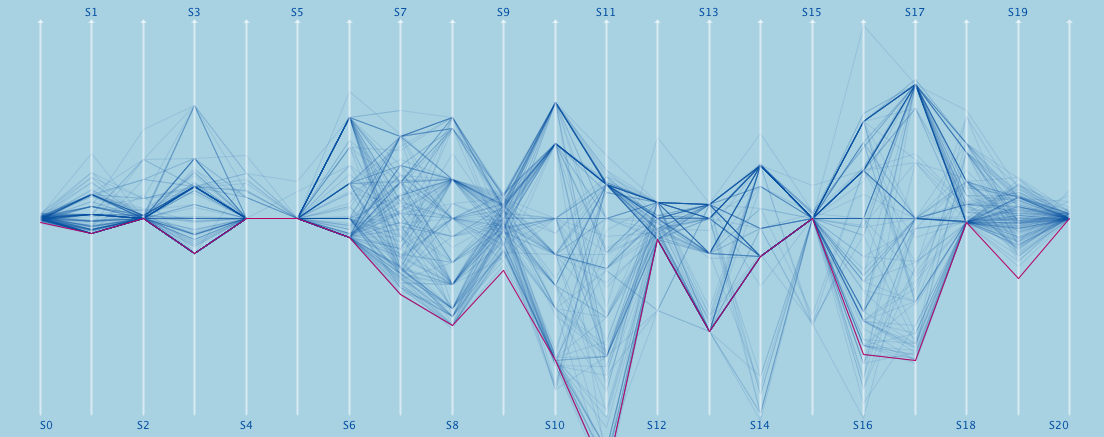
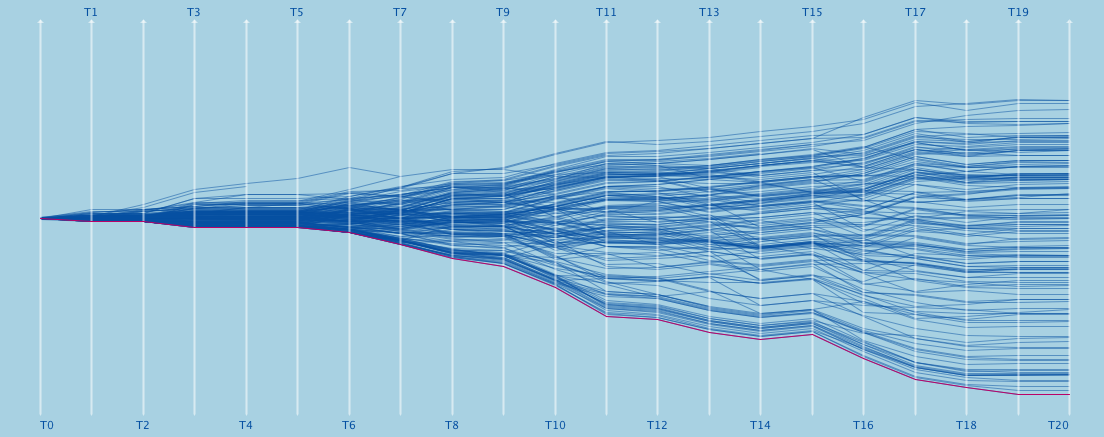
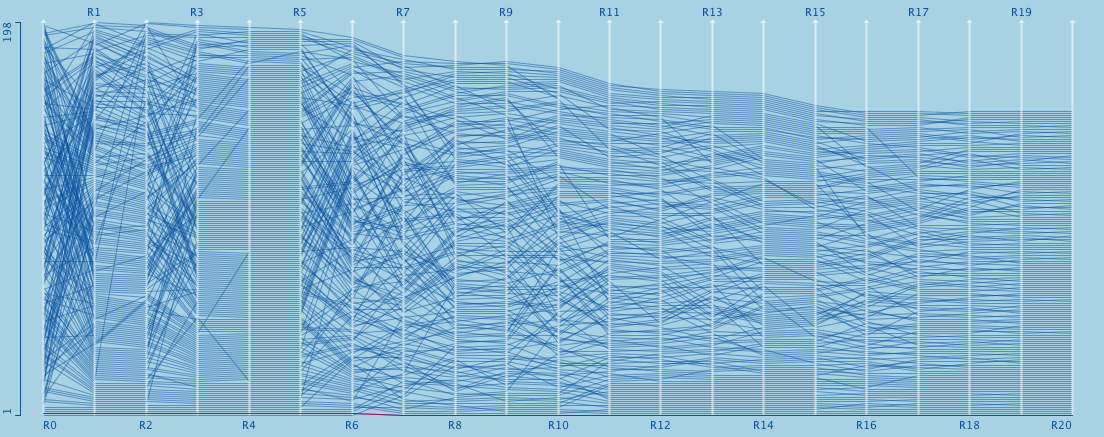
STAGE 20: The trace of the winner – the first British ever.
For those who want to play with the data. The graphs are created with Mondrian.
There is a more elaborate analysis of Tour de France (2005) data in the book.
Of course – as every year – a very big thanks to Sergej for updating the script!


