Understanding Area Based Plots: Tree Maps
Tree layouts are not too uncommon in statistics. CART is build upon tree hierarchies and random forrest uses these trees extensively. Area based plots like barcharts or histograms are also well understood by most statisticians. But when it comes to joining the two concepts – which will yield treemaps – many statisticians get somewhat lost. The reason is somehow related to that fact that concurrent concepts like mosaic plots and trellis displays aka lattice graphics seem to get mixed up.
There will be a series of three posts on the three concepts from which this is the first one on
Tree Maps:
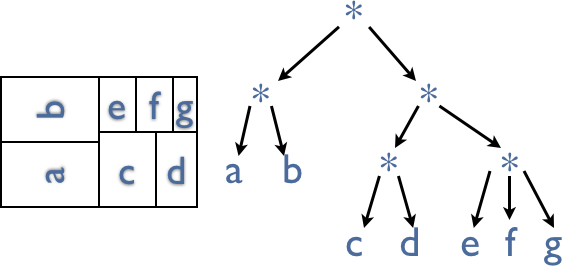
In short, a treemap is nothing else than an alternative display of a tree hierarchy. The primary reference to treemaps goes back to Ben Shneiderman’s technical report. Whereas the classical tree usually “just” shows the hierarchy, a treemap usually also encodes a quantitative attribute which is attached to the leaf nodes (and add up to the root of the tree).
Here is an example of a classification tree

This tree has 10 terminal nodes, and each node has a size proportional to the number of cases, which fall into this category. The corresponding treemap looks like this:

Note that in this tree all splits are binary, which means that in the corresponding treemap the splits always alternate between vertical and horizontal.
Squarified Tree Maps:
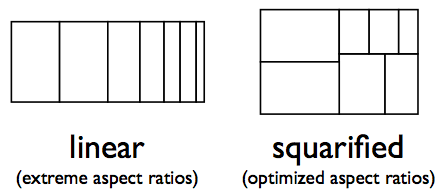
When treemaps are used to visualize a recursive partitioning, the number of splits and terminal nodes will be relatively small. But with arbitrary hierarchies, we will end up with potentially very many splits and/or terminal nodes. As splits on the same level will be split along the same direction, aspect ratios will get extreme. The following sketch shows the problem for 7 terminal nodes of size 6, 6, 4, 3, 2, 2, 1.


Thus we need some way to distinguish between “real” splits, which define hierarchies, and “convenience” splits, which are used to improve the aspect ratios of the tiles.
Cushioned Tree Maps:
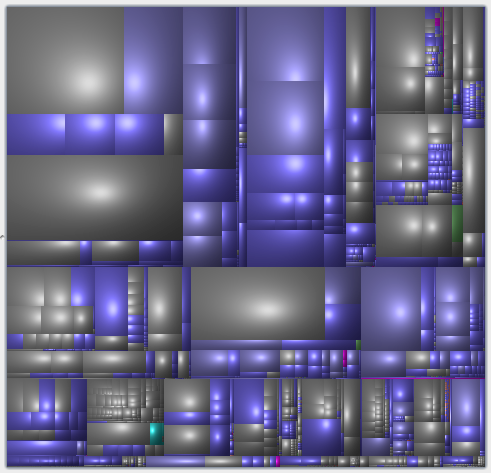
One way to achieve this distinction would be to use thicker lines for “real” splits. The more popular version is to use so called cushioned treemaps. Here is an example, depicting parts of a file system (actually the files of my talks since 1994):

Looks pretty fancy, but does only partly cure the problem.
The bottom line is that if you ever have a hard time to understand a treemap, it is most probably due to the fact of squarification, which does not properly distinguish between hierarchy splits and squarification splits.


[…] is the third and last post on area based plots. Area based was certainly true for tree maps and mosaic plots, but falls a bit short for trellis displays, such that the term “grid […]