The Good & the Bad [6/2012]: Euro 2012 Statistics
This one is almost too bad to present, but I could not resist:

The pie chart shows the number of spectators for the past european soccer championships of the last 50 years – in a pie chart (found on an insert of the “11Freunde” soccer magazine ).
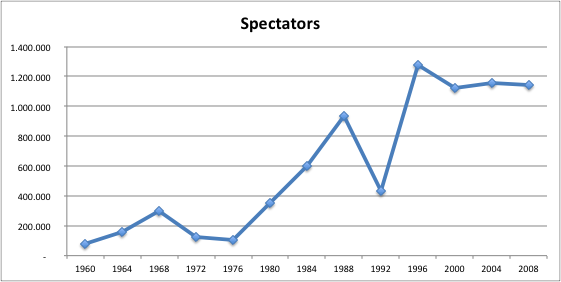
Now “the Good” is too obvious and thus too easy: a simple time series:

Now that looks like a success story. An almost steadily increasing number of spectators bringing in the base cash flow from ticket sales (there are two hick-ups in 1968 / Italy and 1988 / Germany with extremely high number of fans seeing the matches).
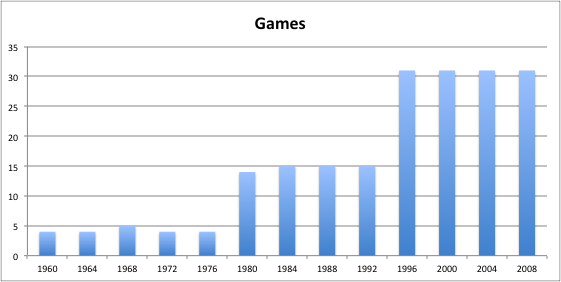
The story behind these number is easy when we look at the number of games played at each of the tournaments:

The system was changed twice in 1980 and 1996 such that far more teams now compete and far more games are played accordingly.
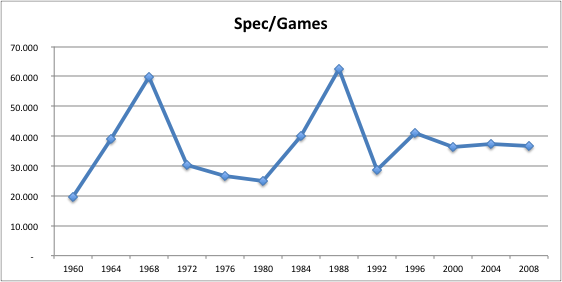
Looking at the number of spectators per game flattens the time series to an almost constant number of roughly 30,000 to 40,000 spectators per game – a number which is almost unchanged for the last 16 years:

There are a several other interesting statistics on the insert, but let’s leave with these figures for now.
Still a long way for the German team to go if they really want to be the champion this time, which I don’t happen to have a good proof for like 2 years ago in the world championship – although I have something (even worse) in mind …
(Sorry for making the graphs in MS Excel, but it was just the fastest …)


