Global Warming: 2 years of new data
2 years ago, I did post the data on the CO2 and global temperature relationship. The conclusion was: at least in the last 10 years, CO2 concentration kept rising, but the global temperature didn’t.
Now, as the last year was the warmest year ever measured, it is time to look at the data again – having two more years of data.
Let’s first look at the scatterplot of temperature vs. CO2 concentration, with the last 10 years highlighted:
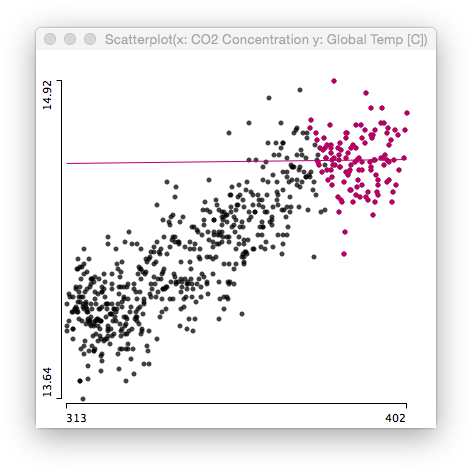 Again, there is no (linear) relationship whatsoever. Certainly CO2 is a greenhouse gas, and we all know how a greenhouse works.
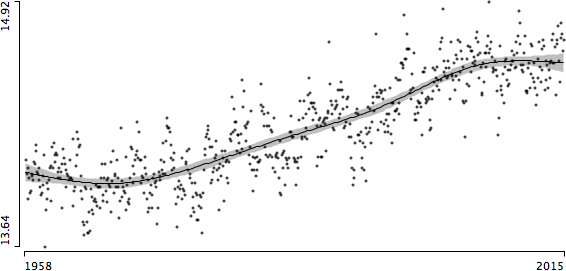
Looking at the temperature development, we can’t ignore that 2014 was the warmest year ever recorded. Nonetheless, when we use a smoother with a wider span (smoothing spline with 6 degrees of freedom), which picks up the almost linear trend nicely, the temperature rise looks like it has stalled roughly 10 years ago:
Using a far more flexible smoother (25 degrees of freedom) we get a different result, indicating a dramatic rise in temperature in the last year:
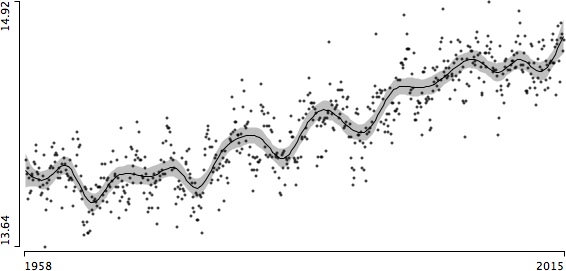
As we all know, the volatility of a trend estimate is always highest at the end, where we only have data on one side of the estimate.
Thus, I am afraid we need to wait for another 2 years of data to tell, whether 2014 was the end of the temperature stagnation or not.

