Tour de France 2010
July 3rd was probably the worst day to start the Tour de France, as many of us where captured by the quarter finals, which sent home nobody less than Diego Maradona’s dream team, which may dream for another four years now …
Although the world cup yet has to see its best matches, I will start to log the results in the usual ways as in 2005, 2006, 2007, 2008 and 2009. Contrary to the world cup, I swear not to give any model that predicts the winner …
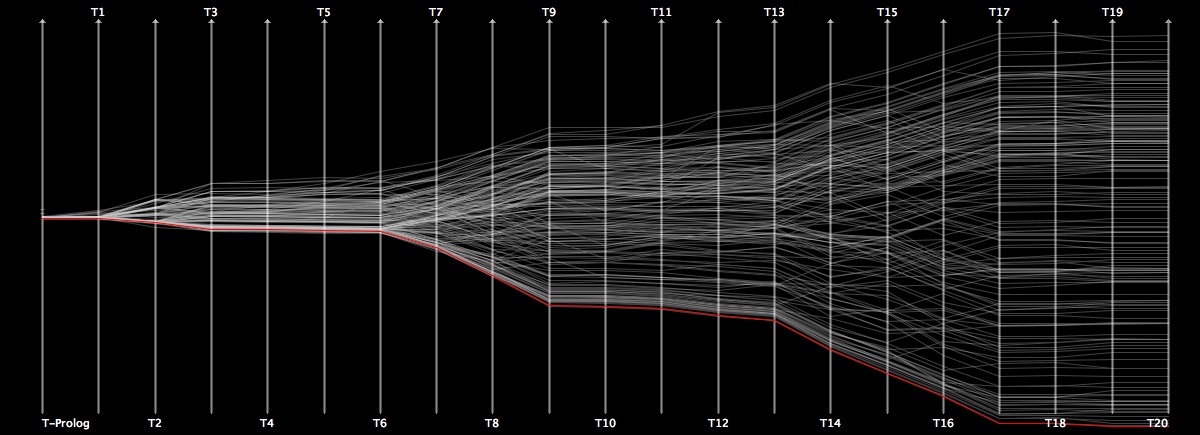
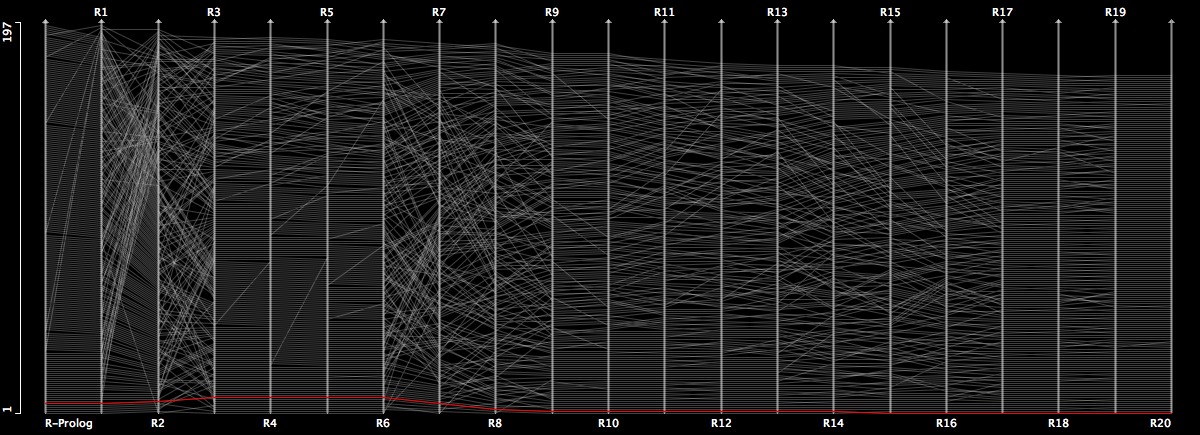
STAGE 2: QuickStep’s CHAVANEL takes the lead – did Fabian ran out of batteries 😉 ?
STAGE 3: CANCELLARA recharged; further spread of the field
STAGE 4: BOLE now last on a day without many changes
STAGE 5: Almost 75% of all riders roll in in the peloton
STAGE 6: GRABSCH “Loser of the day” – 9 drop outs by now
STAGE 7: CHAVANEL back at the top, with a newly sorted field after hitting the mountains
STAGE 8: ARMSTRONG falls behind
STAGE 9: ARMSTRONG gains some ranks on CONTADOR but the gap grows
STAGE 10: SCHLECK and CANCELLARA show quite opposite rank profiles
STAGE 11: LEIPHEIMER and CONTADOR the only “constant” top 10 riders
…
STAGE 14: Neither SCHLECK nor CONTADOR risk any kind of attack
STAGE 15: CONTADOR does not show fair play and gets yellow only due to a technical defect of SCHLECK’s bike – but what would you expect with so many doping allegations on his account …
STAGE 16: ARMSTRONG still good for an extraordinary performance
STAGE 17: 26 drop outs – the rest will most probably make it to the Champs-Élysées
STAGE 18: Not the day of HERNANDEZ, but he knows how it feels to be last …
STAGE 19: GRABSCH and MENCHOV each get their 3rd place
STAGE 20: The profile of the winner, Alberto CONTADOR
See also the summary in this post
For those who want to play with the data. The graphs are created with Mondrian.


