Visualizing Soccer League Standings
I feel ashamed for this boring title, but hope that the entry can make up for it. This visualization did inspire me, as a comment did point to my Tour de France visualizations.
As with all visualizations, we need data first – this sounds trivial, but is sometimes a frustrating show-stopper. After I found the Bundesliga data for each round, the only thing missing was the script to pull the data off the website. R‘s xml-package was the choice:
library(XML)
games = 23
for (i in 1:games) {
   url = paste("http://www.sport1.de/dynamic/datencenter/sport/ergebnisse/
                fussball/bundesliga-2010-2011/_r10353_/_m",i,"_/", sep="")
   rawtab = readHTMLTable(url)
   tab = rawtab[[6]][3:20,c(2,9)]
   ids = order(tab[,1])
   if( i == 1 )
     result = tab[ids,]
   else
     result[,i+1] <- tab[ids,2]
}
resdf <- as.data.frame(result)
names(resdf)[1] = "Team"
names(resdf)[2:(games+1)] = 1:games
write.table(resdf, "Bundesliga.txt", quote=F, row.names=F, sep="\t")
Although I didn’t use readHTMLTable before, it was a 15 min. job to get the script fixed – a definite recommendation for jobs like this!
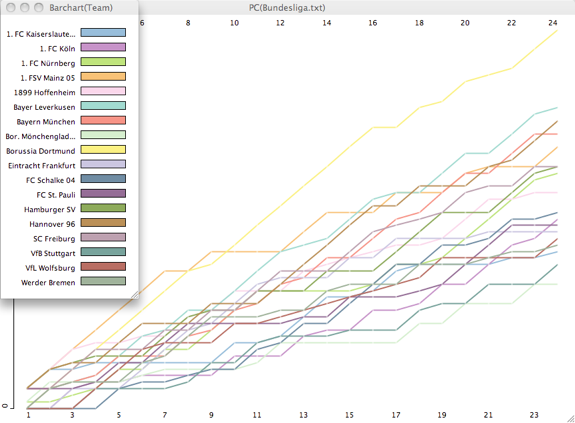
But now to the visualizations: Let’s start with the simple trajectories of the points of each team.

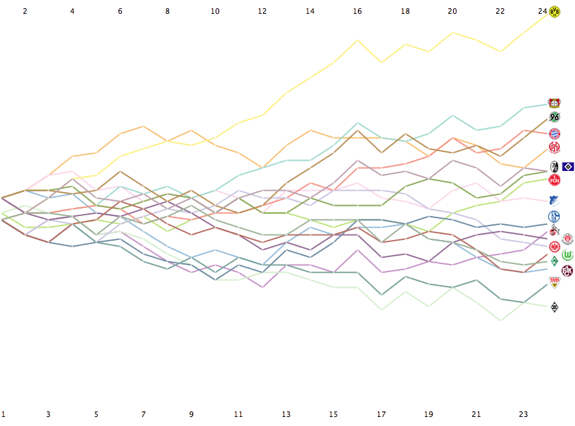
As one of the comments on reddit already suggested, we might want to align the developing scores along the median:

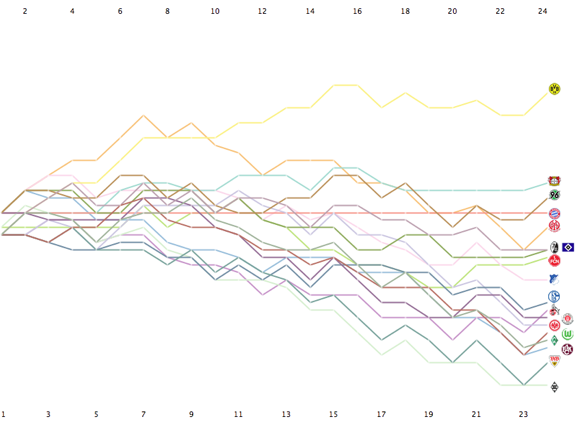
Now, as this weekend the “Rekordmeister” – as the FC Bayern names itself full pride – lost at home against BVB 1:3, it might be worthwhile to look at the scores from a FC Bayern perspective, i.e., we align the scores at the result from the FCB:

Easy to see that the gap to BVB remains at the same level for more than 10 games now, and for roughly five games, the direct opponents are somehow not to get rid off.
Here is the text file, you might use to play around yourself using Mondrian – which was used to create the visualizations.


how did you insert the logos of each club into the graphic? was that done with R or Mondrian?
ps. hooray for Mitchell Langerak, our goalkeeper last season who we miss like crazy
It was neither Mondrian nor R. I used Apple’s Keynote as the placement was quite tricky.
Disclosure: The reddit comment (which didn’t get too much love) was mine (as the club crest next to my nick sort of gives away).