Babylonian confusion or flexibility?
As we are used from UNIX. there is not one single suitable solution to solve a problem, but usually a few different ways to do “the same”. Depending on what commands we know (best), we will chose the one or the other solution. Only the absolute expert will be able to choose the most efficient commands.
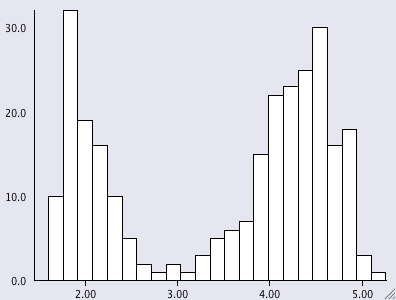
There is a similar situation with R’s graphics (and probably for methods from other domains as well). Let’s look at a simple example like the histogram (I use the Old Faithful Geyser Data here as example).
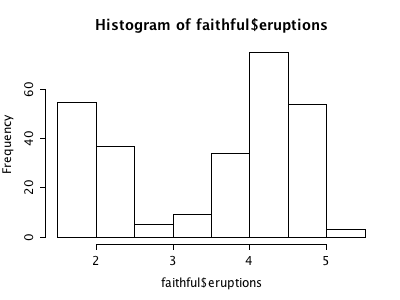
- there is the good old hist which gives
- from the mass library we get the truehist which plots densities
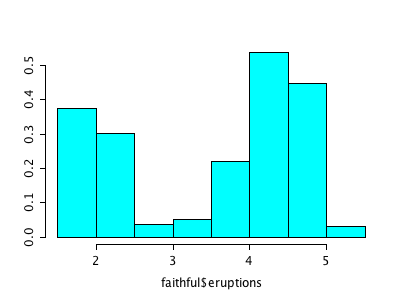
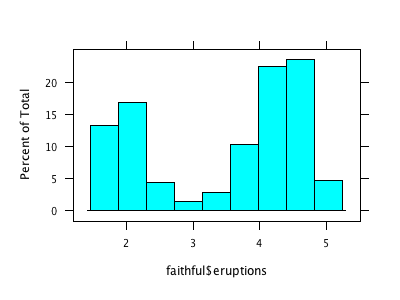
and apparently brings in some more truth, as the bars are different with the same underlying breaks. - the library lattice provides histogram looking like this
- we skip gghistogram from the ggplot library and immediately move to
- qplot from ggplot2, which is actually a call to
qplot(eruptions, data = faithful, geom="histogram")
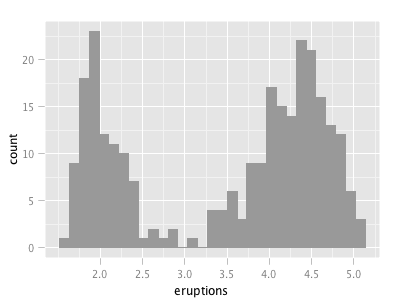
(compared to hist(faithful$eruptions)) - Finally, for those who like things more interactive, there is ihist from the iplots library
I don’t claim that this list is complete, but I think it nicely shows “the problem”. Of course, a “real R programmer” can make any of the plots look like one of the others … The question is more, which of the implementations beyond hist from the base library graphics really adds value to what we already had? The second question probably is, how R will ever resolve the backwards compatibility spiral that might make it look like a real legacy project some time – not to mention the package quality issue?


Lattice and ggplot add a lot of value in that they produce objects with which you can do things. Also, the whole reason lattice (trellis) was created in the first place was to provide a powerful system that takes care of a lot of tedious things. For example, if you want a histogram conditional on some categorical variable, you’ve got it immediately. Just because it also works in the simple case presented above does not mean it is an equivalent alternative to hist().
I would say that having many options does not make R look like legacy at all. If you need something simple, use something simple (like hist()). If you need something more powerful and flexible, use that.
“to whom it may concern”
I was never in doubt, that having graphic objects and conditioning is an advantage (sorry, when I was unclear at this point) but as you already pointed out, there are already two packages which are mostly equivalent from an ordinary user’s perspective.
My concern regards having many packages in parallel with very much overlap and little structured and coordinated progress.
The value-added for lattice and ggplot2 is an overall flexibility, not just a single plot or (necessarily) it’s appearance. How do you combine plot types? What is the entire range of plot types? How easily can you control a plot’s appearance? How easily can you change a plot instead of recreating it from scratch?
Once you feel the need to address issues like this, you will learn lattice or ggplot2 (or both). And once you have learned these sub-languages, you will tend to use their histogram plot instead of the base histogram plot.
In terms of how each looks slightly different in its default, that’s totally a non-issue. If you are using a statistical package and depending on defaults, you will have many more problems than we can discuss here. Defaults are a “reasonable” starting place, but in a scientific discipline you need to analyze what you’re seeing and adjust accordingly.
In terms of legacy issues and package quality, that’s the price you pay for a community project. It adds a certain level of confusion as a newcomer discovers, “Hey, there’s the plot command, but there’s this grid package and lattice and something called ggplot2. Which should I use? And what happened to ggplot1?” And somewhere a nice explanation of the differences would pretty much solve that issue.
Speaking of which, that issue will arise for most any function. Which package is best for creating a neural network? There are at least 3 options. Which package is best for doing HMM’s? Again, you have 3 or 4 choices. Messy, from one perspective, but in most cases there are legitimate reasons for different packages and it’s not too hard to ascertain which ones have been around for a while and are well-maintained and reliable. After that, you need to experiment — the packages are free — and decide which fits your needs/style best.
It’s a different paradigm from, say, using a proprietary tool like SAS and seeing the 1960’s syntax and the seams where packages have been munged onto the original.
Sorry about following myself up. Wish I could edit my previous, to add one more thing…
There cannot really be a coordination of R packages. Each package author is expressing their view of the world, offering users with different approaches.
Base graphics does things one way: very much like drawing on a piece of paper with a permanent marker. And it does not provide you with a way to tweak any processes: the tools are a black box that do what they do.
Lattice is more like drawing on transparent sheets, and it also gives you the hooks to modify how things work internally. It is very programmerly in its approach.
A user of lattice decided that the “replace the code in the hook function” programmer’s approach could paint you into a corner and was not the best philosophy, so they created a more Legos-like approach with ggplot2.
You’re looking at it from a functional perspective: line plot, scatter plot, histogram. And along that axis, the packages overlap. But their true distinction is along another axis: approach and technique.
For example, say you want to overlay a scatter plot and a curve. In base graphics you simply call two different plot routines without clearing the plot area. (You have to make sure they are using the same scales and don’t both write labels, etc, yourself.) In lattice, you may end up creating a custom panel function that uses other lattice functions. In ggplot2 you would combine the two plots with ‘+’.
So there’s no way to coordinate these three packages, and it really would not be a good idea to begin with.
(To be honest, graphics is the EASIEST multi-package issue to address because of this orthogonality of approach. Ask yourself which package you should use to do ANN’s or HMM’s or to work with date/time data sometime. That can get confusing!)