Presentation vs. Exploration
Giving a clear separation between presentation graphics and graphics for data exploration is not always easy, because many aspects of the graphics are shared by both types. I very much liked the distinction Antony Unwin gave during one of his latest talks.
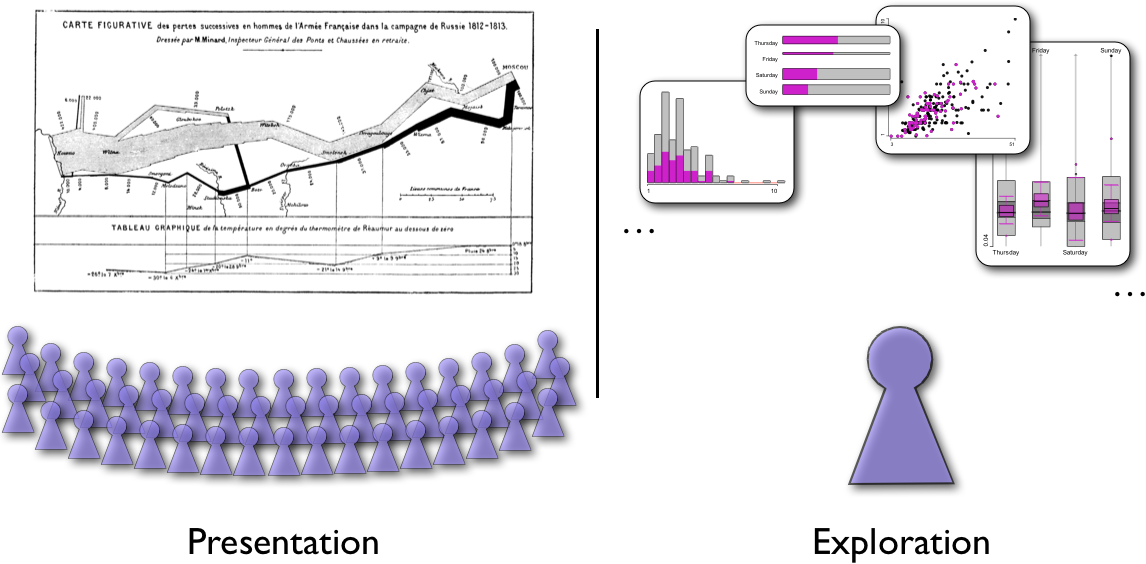
The difference is quite obvious when you look at the ratio of graphics and observers. In presentation graphics we need to build very few – or even just one – graphics for very many (potentially quite different) observer. In exploration graphics often a single researcher looks at a lot of graphics, which only make sense as a linked ensemble.
Any further thoughts …?

