Crisis – what crisis?
Some months ago I stumbled over the website of the ifo-institute, which is one of Germany’s most renowned instances when it comes to judgement about the economical situation of the country.
They feature the so called “ifo Index”, which gives an indication of how well the economy is doing based on a survey of a cross-section of various companies (and actually have the data available for download).
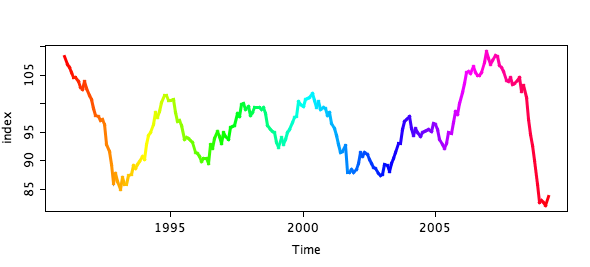
I was very surprised to see such a periodic and regular pattern of the economic cycle. Ok, probably not that regular than other time series like the e.g. CO2 time series, but regular enough to detect an upcoming downswing without being an economic guru. Things get even more obvious when you know that the index is combined out of the assessment of the current economic situation and the expectation for the near future. Plotting these two quantities in a scatterplot shows a (probably not so) surprising spiral pattern.

I marked three points in time in the plot. Whereas many politicians and economists seemed to be surprised by the upcoming (financial) crisis, it is pretty easy to see that the downswing did start in May ’08 and gained full momentum even before the banks crashed in September ’08.
The positive take home message from these plots is definitively that – according to the index – we hit the bottom of the recession.

